For Nonprofits Blog
You're changing the world. We want to help.
How to keep track of multiple marketing channels (and save time) with Google Analytics
Monday, July 22, 2013
Together we’ve walked through how to
design a nonprofit measurement strategy
and how we can use Google Analytics to
get the metrics that we need
. Now that you’re off to the races with your new measurement plan, here are a few non-technical things you can do to make monitoring
your data easier and more insightful.
Monitor KPIs with a custom Analytics Dashboard.
Using a custom dashboard will help you easily view metrics that are important to you in Analytics. If you’re looking for a template, here’s a
Google Analytics Dashboard for nonprofits
created with
our measurement strategy in mind
. Remember, you need to have
Ecommerce tracking
implemented to track donations and
goals
configured to track KPIs. If you’re not using those features then you will not see any data in the dashboard.
Understand how your marketing activities work together with
Multi-Channel Funnels
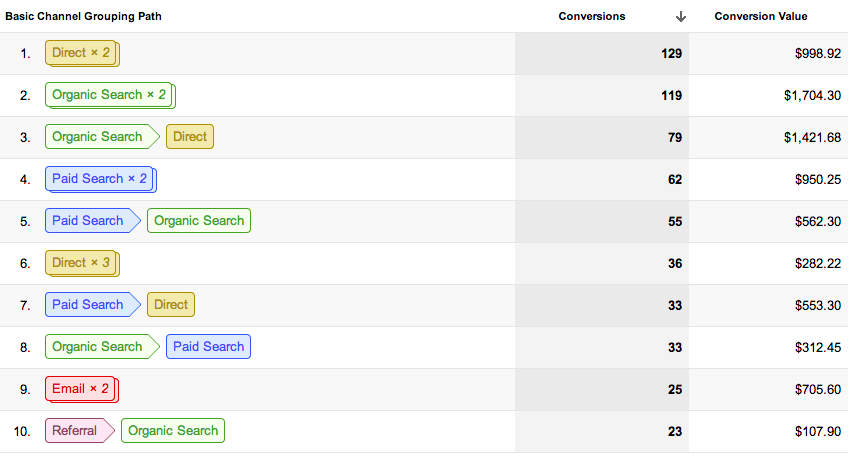
. Often an online donation isn’t the result of a single effort like an online ad, but actually the result of multiple marketing channels working together. If we only examine the last touchpoint before a donation or other online goal is made, we could miss several important insights and opportunities. That's where Multi-Channel Funnels come in.
Multi-channel funnels allow you to see interactions across different digital media and show you how those channels then work together together to reach an online goal, like a donation or volunteer sign-up. When you set-up goals or track Ecommerce transactions in Google Analytics, Multi-Channel Funnels will automatically
generate five reports
to show you that data. Using this information, you can get a deeper understanding of the value your marketing efforts.
We hope these tips help you implement and easily track a measurement strategy in line with your mission. If you'd like to learn more about Analytics, visit our
YouTube channel
and
Google+ page
for more tutorials, updates and ideas on how you can leverage our tools to help your nonprofit.
Posted by
Justin Cutroni, Google Analytics team
Using Google Analytics to measure your organization
Monday, July 8, 2013
Successful measurements are a tangible way to analyze how well your nonprofit is achieving its mission and objectives. Now that we’ve discussed
how to set up a measurement framework
, how are you going to gather the data? Fortunately, a fairly basic implementation of
Google Analytics
will give us almost everything we need. Here are four steps to get you started.
1. Tag your pages.
Once you sign up for Analytics, you’ll be given a tracking code to paste onto your pages so you know when your site is visited. With your pages tagged, you can see all kinds of data including daily visits, time spent on site by country and traffic types. If you need help getting started with tracking, check out this step-by-step guide
here
.
2. Track KPIs with the Goals feature.
Goals
are completed activities that happen on your site, like someone filling out and submitting a volunteer sign-up form. We can easily translate the key performance indicators (KPIs) we designed in
our measurement framework
into Analytics Goals. For example if your KPI is volunteer sign-ups, you could track it by setting a goal of how many people reach the volunteer sign up confirmation page.
Remember, you get 20 goals, so there are more than enough for all KPIs across the various business strategies. Learn how to set yours up
here
.
3. Measure donations and donation type with ecommerce tracking.
Ecommerce tracking allows you to track total donations and differentiate donation type as a different product. This feature also enables reports that will give you insight into the behavior of your donor, including how many times they visited your site before donating and how many days between their initial visit to your site and their donation. Understanding how, why and when people give can help you make better decisions about allocating resources and future marketing efforts. You can begin implementation by activating the reports and installing additional code
here
.
4. Segment users with custom dimensions.
Custom dimensions is a feature that lets you collect custom data with Google Analytics. For example, you could use a custom dimension to segment your website visitors into groups like volunteers and donors. When someone submits a donation your custom dimension will indicate the user is a donor. Or when someone volunteers via your website, they’ll be identified as a volunteer. With that segmentation, we can gather specific data on our donors and volunteers which allows us to measure our KPIs and get a better understanding of our users. To begin using custom dimensions, follow our implementation instructions
here
.
If you'd like to learn more about how you can leverage our tools to help your nonprofit, visit
our YouTube channel
and
Google+ page
for more tutorials, updates and ideas.
Posted by Justin Cutroni, Google Analytics team
Creating a measurement strategy for your nonprofit
Monday, June 24, 2013
As nonprofits, measuring the success of your organization can often be tricky. If your mission is “Improving lives”, what metrics can you use to show that? We’d like to help. We’ve created a framework that you can use to evaluate your nonprofit more effectively. Follow along with me below and by the end we’ll have developed metrics, targets and much more that will allow you to show the success and growth of your nonprofit.
To get started, we’ll use a fictional nonprofit called Nonprofit X or NPX, for short.
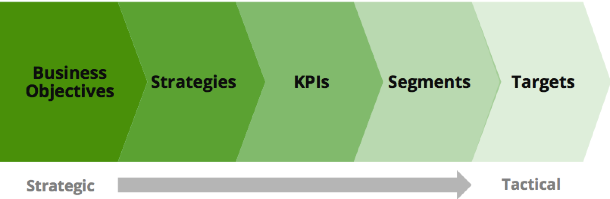
1. Everything starts with the organizational mission
. Once we know that, we can investigate the strategies and tactics needed to execute that mission or business objective. All along the way, we’ll define pieces of data that help up measure the performance. For our fake nonprofit, NPX, our mission will be to “Improve the lives of those that are in need of stable, safe housing.” Knowing our mission is important because that’s what we’ll measure and how we’ll define success for our strategies and other tactics. In the case of NPX, our measure of success is improved lives. Although that metric doesn’t exist in any tool, we can use it to define strategies that accomplish it.
2. Identify strategies to accomplish your mission.
We can identify strategies by interviewing people at the top: board members, executives, etc. For NPX, we have three primary strategies: fund homebuilding projects by generating donations, coordinate volunteers to build houses and raise awareness of our cause. Once your team works together to outline strategies, your next step is to outline tactics.
3. Outline tactics to execute your strategies.
Nonprofits can have one or more tactics to achieve each strategy. Strategies don’t often change over time, but the methods or tactics we use to implement those strategies do. To keep things simple, we’ll keep all of of our NPX tactics web-based. NPX’s tactics include collecting donations via a website, recruiting volunteers via a website and educating the public about the lack of housing via an informational website. With our tactics ready, we’ve now reached the good part.
4. Measure tactics with key performance indicators (KPIs).
Each KPI should measure the performance for our tactics. Creating KPIs can be a bit tricky, since you have to understand how to measure your top line strategy (mission, etc), but also what you’re capable of tracking with your tools. You don’t need several KPIs for each tactic, maybe 3 to 5 for each. For our NPX tactic of collecting online donations, we’ll want to look at metrics like revenue and average donation size. With recruiting volunteers, our KPIs will be the number of volunteers and number of searches for volunteer activities. We’ll measure our success in educating the public with how many people submit a letter to congress on our behalf and watch our informational video.
5. Identify segments to understand changes in your KPIs.
Segmentation, which is the foundation of all analysis, helps us understand why our KPIs move up, down or stay the same.
For our donation strategy, we’ll want to split revenue by marketing activity that generated the revenue so we can calculate ROI. We’ll also want to segment donation based on donation type and identify repeat donors.
Segmenting the volunteer KPIs is similar. We’ll want to see how different marketing campaigns perform, differentiate repeat volunteers from first-time volunteers and segment based on geographic location (as NPX volunteer opportunities are geographically based).
Next is cause awareness. We’ll start by segmenting by traffic source, visitor type and content type. We want to know what sources brought in our users, so we can spend money and time around those in the future and be able to see how people are engaging on our site.
Now that we have segments, it’s time to add some context to the data in the form of targets.
6. Add context to your segments and KPIs with context.
Targets are how almost every business evaluates performance. Organizations, at the beginning of the year, often lay out where they want to be every month or quarter. Then as the year proceeds you can compare where you’re at with where you need to be. You can also account for upcoming activities when determining if you will, or will not, make your targets.
Now that we’ve created our measurement strategy, we’ll need a way to get our measurements. So next up, we’ll show you have to translate this plan into a Google Analytics implementation. If you’d like to kickstart learning about Google Analytics, check out our
guide
and
video tutorial
designed specifically for nonprofits.
*The original framework was created by fellow Googler
Avinash Kaushik.
Posted by Justin Cutroni, Google Analytics team
New Learn with Google webinars to help you become a smarter digital marketer
Thursday, May 2, 2013
At Google, one of our goals is to help make the web work for you. Today we’re announcing a new series of Learn with Google webinars, which will teach you how to use digital to build brand awareness and give you the tools you need to drive sales and grow loyalty and retention. Each of our sessions gives you deep-dive educational content, across a breadth of products and marketing objectives, in a format that’s convenient for you. Every webinar is led by Google product experts and includes time for audience Q&A. Sign up to start becoming a smarter digital marketer now.
Upcoming live webinars:
May
[YouTube]
Driving Direct Response with Video
[Shopping]
Google Shopping 101: Google Shopping for Beginners
[Research]
New Research: How US Shoppers use Smartphones in Stores
[Mobile]
Driving Deeper Engagement with your App Users
[Mobile]
Driving Brand Engagement with Mobile Rich Media
[Analytics]
Measuring Success in a Multi-Device World
June
[Mobile]
Understanding Mobile Ads Across Marketing Objectives
[Shopping]
Google Shopping 201: Merchant Center Deep Dive
[YouTube]
Building your Business with YouTube Video Ads
[Analytics]
Metrics for the Mobile App Ecosystem
[Search]
What's New & Next in AdWords
[Analytics]
Unleashing the Combined Power of Google Analytics & AdWords
[Social]
Growing your Business & Engaging your Audience with Google+
[Shopping]
Google Shopping 301: Creating & Optimizing Product Listing Ads
[Social]
Launching & Amplifying your Impact Across Social Channels
[Display]
Reaching the Right Audience with Remarketing
[Research]
Creating Custom Infographics with the New Google Databoard
Webinars are held Tuesdays through Thursdays at 10am Pacific/1pm Eastern.
Visit our
webinar site
to register
for any of the live sessions and to access our large library of recorded content. You can also stay up-to-date on the schedule by adding our
Learn with Google calendar
to your own Google calendar to automatically see upcoming webinars.
During our last series of webinars, attendees had the chance to win a Nexus 7. Clint Wilson was our lucky winner and he’ll soon be enjoying all of the tablet’s cool features
. Check out our upcoming webinars for another chance to win!
Learn with Google is a program to help businesses succeed through winning moments that matter, enabling better decisions and constantly innovating.
We hope that you’ll use these best practices and how-to’s to maximize the impact of digital and grow your business. We’re looking forward to seeing you at an upcoming session!
Posted by Erin Molnar, Marketing Coordinator, Learn with Google
Google Tag Manager: Video and Q&A
Wednesday, November 28, 2012
(Cross posted from the
Google Analytics blog
)
Have you ever struggled with implementing new marketing and measurement tools on your website? For many people, deploying data collection “tags” (like conversion tracking, remarketing, audience reporting and analytics) can take weeks or months. Worse, the tag implementation is often incorrect, meaning you’re missing out on valuable information about your site and its users.
It doesn’t need to be difficult. We recently held a webinar to introduce users to
Google Tag Manager
, a free tool that helps marketers and IT departments manage their marketing and measurement tags quickly and easily. Watch the video here to learn more about:
Overall benefits and features of using Google Tag Manager
A quick demonstration of how to deploy a new tracking tag
Tips for getting your company started with Google Tag Manager
In addition to this webinar, we’ll be hosting a technical webinar in January to help new users through the nuts and bolts of installing Google Tag Manager (with lots of concrete examples). Stay tuned -- we’ll share registration information in a future blog post, or you can check back on the
Learn with Google webinar site
.
Read on for responses to some of the top questions we received during the webinar.
Questions and Answers
Where can I find out more about the core concepts described in the webinar?
To learn more about the Google Tag Manager management interface, please visit our
Help Center
-- you may want to start with our
Before you Begin
article. There you can find more information about key concepts like
Tags
,
Rules
, and
Macros
. For developers interested in how to implement Google Tag Manager, please visit our
developer documentation
. Or if you’d like help with implementation, you can contact one of our
Partners
. You can also ask questions (and find responses to questions from others) on the Google Tag Manager
product forum
.
What happens to historical data if we move to Google Tag Manager?
All of your historical data should be preserved when you move to Google Tag Manager. Google Tag Manager only changes the way that tags are deployed and managed on your site, it does not change the way data is collected.
How would you migrate a tag?
Follow these steps to migrate tags -- whether it’s a single tag or all the tags on your site. If you’re just getting started, take a look at our
Before you Begin
article.
Create a Google Tag Manager Account and a Container
associated with that account.
Install that Container code snippet on every page of your website (so that it appears immediately after the opening <body> tag). The container should be empty.
Map your site - thinking about what data you want to collect, what events you want to track, and which tags you want to use to track that data. You should think about where your current tags are implemented, but now is a great time to rethink your overall data collection goals and start fresh.
(Optional) If you would like to make use of the
Data Layer
functionality, create a data layer on the pages where you wish to pass information or fire tags
Create Tags, Rules and Macros within the Google Tag Manager interface according to the map you just created. Make sure to apply the correct Rules to your Tags to make sure they fire in the right place.
Test the changes you’ve made in Google Tag Manager using
debug and preview mode
.
Then push a version of your site live that has removed the hard-coded tags from within the page. At this time, also
Publish
your changes using the Publishing feature of Google Tag Manager, which pushes the changes live to the site.
For more precise details on these steps, read our
developer documents about migration
.
Can you add tags to events or buttons?
Definitely! In order to use Google Tag Manager to fire tags on events and buttons, follow these steps (for more detail, read our
developer document on event handlers
):
On your page, proactively add the dataLayer.push({ ‘event’: ‘myEventName’}) to the event handlers for all events and buttons you might want to track.
Create a new rule where “event equals myEventName”.
Associate this rule with any tag you’d like to fire when the specified event happens.
Can hard-coded tags and tag manager co-exist? Do I have to remove my other tracking tags?
We strongly recommend that you completely migrate all your tags, so you can take advantage of the benefits of managing and updating those tags within Google Tag Manager. However, if a full migration seems too hard, you can use Google Tag Manager in parallel with hard-coded tags. Some of our users use Google Tag Manager to only manage adding new tags.
If you choose to do a partial migration to Google Tag Manager, you need to be very careful to make sure you don’t accidentally start double-counting your tags. If you decided to deploy a tag via Google Tag Manager, make sure that you don’t have a version of the same tag firing on the same page.
Can you build your own custom tag templates? And how do I become a recognized Tag Vendor within Google Tag Manager?
Custom Tag templates within Google Tag Manager allow you to copy/paste any HTML or Image tags directly into Google Tag Manager and fire it based on your predefined rules and macros. To turn it into a template, use the
{{macro_name}} syntax
to populate the tag code with dynamic values. We will also do a syntax check to ensure that when you copy your 3rd party tag, it will fire as intended.
If you’re interested in having your tag added to the list of predefined templates, apply to become a Tag Vendor within Google Tag Manager by completing
this interest form
.
How does this work with Google Analytics? How do you do things like track pageview and track event within Google Analytics?
Google Tag Manager is a convenient way to correctly deploy Google Analytics across your site. To use Google Analytics within Google Tag Manager, simply create a Tag with the
Google Analytics tag template
. You can select the “Track Type” as either a pageview, an event, or a transaction.
Make sure you have some version of the Google Analytics tag firing across all pages on your site. A good way to do this would be to have a basic tag firing on all pages, but blocking on pages where your more customized tags are firing (like the thank you page where you’d be firing a specialized transaction tag type).
Can the Google Tag Manager snippet be placed in <head>? How about in my footer?
The recommended best practice is to have the Google Tag Manager snippet at the top of the <body> to maximize data collection, but some clients may find it easier to implement the Container snippet elsewhere in the in the page, like the footer.
Do not place the Google Tag Manager snippet in <head> (for the IT folks: this is because there is an iframe in the <noscript> case, which can have unpredictable results in some browsers).
No matter where you install the container snippet, you will need to make sure that this snippet of code is on every page of their site. Google Tag Manager will still work if you only deploy it on part of your site, but Google Tag Manager’s rule based system will only work on pages where the snippet is deployed. For more details, read our
developer documents
.
Does Google Tag Manager replace Doubleclick Floodlight?
No, Google Tag Manager does not replace Floodlight -- they are complementary. Floodlight is a conversion pixel for DoubleClick products (
Floodlight tags
can now be deployed within Google Tag Manager), and Google Tag Manager is a tag management system or “container tag” for multiple tagging technologies. Floodlight has previously been used by some users as a container tag as well, but moving forward, Google Tag Manager is a way to deploy all tracking technology.
You also have the ability to pass custom floodlight variables through Google Tag Manager into Floodlight, through the Data Layer. For more information, please review the material in the
Developers Guide
.
We hope this webinar and this blog post will help you as you get started with
Google Tag Manager
, and we look forward to seeing you at our technical webinar in January. (Registration details coming soon).
Posted by Laura Holmes, Product Manager, Google Tag Manager
How Two Nonprofits Improve Their Site Performance With Google Analytics
Tuesday, May 29, 2012
(Cross posted from
the Google Analytics Blog
)
At Google, we’re proud that our products are used by nonprofits to help them better achieve their objectives and improve the world. We believe that data holds amazing power for all types of organizations and it’s inspiring to see some forward-thinking nonprofits live at the edge of adoption. Today we’d like to share two brief case studies we’ve published: how the
Public Broadcasting Service
(PBS) and
San Francisco Museum of Modern Art
(SFMOMA) are using Google Analytics. Links to the full case studies are included after each summary if you’d like to dive deeper.
By tailoring the features of Google Analytics, LunaMetrics helps PBS increase conversions and visits by 30%
Top Notch Programming, The Public Broadcasting System’s interactive arm, helps individual PBS producers and local PBS stations create and promote each section within PBS.org for programs such as NOVA, American Masters, and Sid the Science Kid. A selection of web analytics tools had been installed, but these proved difficult to maintain and use. PBS wanted to develop a coordinated approach to analysis and reporting that would inform their future strategic decisions.
Led by Web Analytics Director Amy Sample, the team at PBS needed a cohesive system across the entire enterprise, and for this they turned to Google Analytics. In addition to top-level analysis of PBS.org and PBSKids.org, they also hoped to implement a solution that would allow producers of individual programs to see only the data on those pages and microsites that related to their own shows. It was critical to have a solution that gave Amy the over-arching view she needed, and the microcosm view that each producer needed. To meet these requirements, LunaMetrics devised a custom technical solution for PBS that expanded their existing standard implementation.
Google Analytics has been a key facilitator in the transformation of PBS online. The tool enables reporting that is robust, tailored and meaningful, which means that stakeholders are no longer focused on static monthly reports. Instead, they are increasingly able to use analytics to inform critical and timely business decisions on a day-to-day basis. Analysis of search engine trends led to an increase in PBS traffic by 30% during the first year after implementation. PBS also used valuable conversion funnel data to optimize the registration path in PBSKids; this activity increased conversions by one-third. Furthermore, since Google Analytics was set up to allow PBS to evaluate the way users consumed video, the broadcaster created two new portals: PBS Video and PBSKIDS Go!
Read the full PBS case study here
.
SFMOMA Chooses Google Analytics and Masters the Art of Metrics
In 1995, SFMOMA was one of the first museums to launch an institutional website.
SFMOMA.org
offers a fluid space of exploration in which visitors can easily navigate an online collection of more than 9,000 artworks and a rich archive of studio and video content. The site also has an online store and a detailed calendar of exhibitions and events.
Their primary goal was to develop rich, dynamic content that engages visitors and keeps them coming back to the website as well as the physical museum. SFMOMA’s website receives nearly four times the number of visits than the physical museum. Providing compelling digital content that visitors want was as critical as hosting popular exhibitions.
Google Analytics Certified Partner E-Nor helped SFMOMA connect key business objectives to a robust web analytics strategy and recommended Google Analytics as the best solution for their needs. As a result of the switch to Google Analytics with a thorough implementation plan, SFMOMA saw a tremendous increase in available insights about their online presence. They realized a 15% gain in traffic accuracy, and so were more willing to make decisions based on the data.
They could clearly see what content users liked best, and made changes and improvements to their website to keep them coming back. Their marketing campaigns were tied to sales and other goal conversions, and so they could optimize accordingly.
All this new data is helping produce valuable insights on how the website is used and what marketing efforts and website designs are delivering results. SFMOMA is now prepared to continue its online leadership thanks to careful planning and strategy coupled with an expert use of the advanced features in Google Analytics.
Read the full SFMOMA case study here.
Posted by the Google Analytics team
Getting Started With Analytics
Monday, May 14, 2012
It’s often hard to know how to improve your website. Sure, you may have the greatest resource hub ever, but are people actually using it? What’s the deal with metrics like time on site--is longer better because people are exploring your great content, or is longer worse because people are confused and lost?
Google Analytics
, a free tool that provides detailed information about your website traffic, can help you answer these questions. Once you’ve installed it on all pages of your website (instructions
here
), you’ll be slicing and dicing data in no time!
The first step towards analysis with Google Analytics is thinking about the different groups of people who might visit your site. Say your organization tutors low-income students. You might have three types of people visiting your site--donors, volunteer tutors, and the students themselves. Take a second and make a list of all the different sorts of people who might visit your own website.
Next, think about what these groups of people might be looking for. The students might want to know when you’re closed for holidays, or they might be looking for resources to help them with that tricky geometry homework. Donors could be trying to donate online, or maybe looking for more information about your organization’s mission. Volunteers may be looking for a list of upcoming volunteering events, or for a sign-up link for your newsletter.
Once you’ve figured out who is visiting your site and what they might be looking for, it’s time to use Analytics if these people are getting what they want. The
“Goal”
feature of Analytics is designed for just this purpose. URL destination goals are a great place to start. This goal type allows you to track visits to specific pages of your site--for example, the “Thank You page” that comes up after a successful online donation, or a page with information about volunteering hours. You’ve already figured out what your visitors are looking for--now translate these into URL destination goals!
Once you’ve created these goals, they’ll show up each of your
reports
within Analytics. You’ll be able to look at goal completion rate, which is one way to measure your website’s effectiveness. You can compare goal completion rates for different referring sites or landing pages, allowing you to see which of your partnership efforts is the most effective.
Now that you have a good sense of how your website is performing, you can begin to find ways to make it even better! One great report to look at is the
“Visitor Flow”
report, which shows you the pages people visited en route to your goal URLs. Take a look at these paths and see if anything looks unexpected. Did a high number of users end up on the resources section of your site after visiting the donation section? Did many users visit ten pages before finally finding your hours of operation? Are there popular paths that involve both pages targeted specifically at donors and pages targeted at beneficiaries? If so, this may suggest that the flow of your website is confusing. Consider including more direct links to your goal pages on your home pages to facilitate use of your site.
Your website should make it easy for all of your visitors to find what they’re looking for--you wouldn’t want to miss out on potential donors because the online donation process is confusing, or turn away volunteers who can’t find an updated calendar! With just a little set-up, Analytics can help you determine whether your website is helping you or hindering you--and it can show you what you can change to improve your performance.
Posted by Eva Breitenbach, AdWords Team
Energy Works Michigan Brings Renewable Energy To Schools With Online Tools
Thursday, September 1, 2011
We are always interested to see how nonprofit organizations have used Google products and tools in interesting ways to support their missions. The story from
Energy Works Michigan
is one that highlights the way a small organization can combine Google products and optimize their resources to have a great impact on its community.
Energy Works Michigan has been awarded a grant by the Michigan Public Service Commission to administer the Michigan Renewable Schools Program. Through this program, Energy Works Michigan implements energy efficiency and renewable energy measures at Michigan K-12 schools, colleges, and universities -- with an overall mission to building foundational capacities for a sustainable, equitable, and prosperous future in Michigan. To date, Energy Works Michigan has partnered with 67 public, private and charter K-12 schools and districts throughout the state of Michigan.
Their 4-person team, made the decision to use
Google Apps
to communicate, collaborate and most importantly, keep organized. However, in order to tackle so many schools, they knew that they needed to use more than just Google Apps. Their organization now relies on several Google products such as
Google Earth
,
Google SketchUp
and
Google Analytics
. So how does Energy Works Michigan use all of these products?
Google Earth
: Each year, Energy Works Michigan identifies a new set of schools to work with to install solar photovoltaic or wind turbine systems at schools. As they have so few staff members, the organization is not able to travel immediately to every school that wants to partner with them. They use Google Earth to conduct preliminary site assessments of schools -- and determine which renewable energy system makes sense to install. Google Earth allows them to determine the orientation and elevation of the building of a school, and also to evaluate angles of the sun and wind.
Google SketchUp
: Google Sketchup is a 3D content creation tool intended for intelligent drawing and design of architectural and mechanical prototyping. Energy Works Michigan uses
Google SketchUp
to share a visual representation of the renewable energy system with their partner schools, such as the solar panels they rendered for Cass Technical High School in Detroit, MI:
Google Analytics
: Using
Google Analytics
, Energy Works Michigan has been able to to track their site traffic, and improve their promotion efforts, messaging and content strategies based on historical navigation patterns. Viewing traffic volume on specific pages has been particularly useful because it helps determine the programs and information visitors are interesting in most. Energy Works Michigan can then promote and enhance these sections.
According to Executive Director, Emile Lauzzana, Google products have allowed the organization to use the staff’s time more efficiently and have enabled them to quickly assess site conditions for renewable energy installations. They’ve also allowed the organization to share schematic 3D graphics of renewable energy systems to their clients and produce a clear and legible display of their partner schools on maps, making their work more understandable to their clients and to other visitors of their website.
It’s exciting that Energy Works Michigan has been able to leverage Google tools to further advance their outstanding mission.
Posted by Clemantine Wamariya, Google for Nonprofits Summer Intern
Using Analytics To Understand Your Website's ROI
Wednesday, June 8, 2011
A lot has been written about how important it is for nonprofits to have a presence on the Internet. While social media outlets offer new opportunities to communicate online, websites remain a primary way that organizations engage people on the web. A well-designed website that is frequently updated with interesting content can attract many unique visitors every day, so nonprofits dedicate significant resources to the development and maintenance of their websites. More visitors to your website means more people know about your organization and that’s a good thing, but should you expect more from your website? Yes!
Websites are a powerful marketing tool for nonprofits, so it is important to measure and understand their impact on your organization’s bottom line. Measuring is the easy part thanks to
Google Analytics
, a free tool that provides detailed information about your website traffic and marketing effectiveness. Within Google Analytics you can define and track customized “
Goals
” based on visitor actions that are valuable to your organization. Example goals for a nonprofit would be online donations, event registrations, and mailing list sign-ups.
Once you’ve set up goals and Google Analytics has begun gathering data to measure them, it’s time to think about how the data should be analyzed. A good starting point would be using the data to determine which of your website goals provides the most value to your nonprofit. Knowing that information can help you decide how resources (e.g., programming hours, AdWords credits to drive traffic) should be allocated in the future. Let’s look at how you could calculate the value of the following goals: online donations, event registrations, and mailing list sign-ups.
Valuing donations made via your website is easy if you use
Conversion Tracking
in your AdWords account. Installing a Conversion Tracking code snippet on the “Thank You” page will enable you to track the number of donations (i.e., conversions) and their dollar value. If you prefer not to use Conversion Tracking, you can use Google Analytics goals data and data from your online payment processor to determine the average online donation amount. Divide the dollars donated via your website during a month (week, quarter, etc.) by the number of people who triggered your donation “goal” in Google Analytics and the result is your average online donation amount. What about finding the average value of a visit to you donations page, since not every visitor makes a donation? To find the average value of a visit to your donations page, divide the dollars donated via your website during a month (week, quarter, etc.) by the number of people who visited your donations page during that time period.
Average Online Donation =
Total Online Donations/Total # of Online Donors
Avg. Value of Visit to Donation Page =
Total Online Donations/Total # of Donation Page Visits
Determining the value of online registrations for events depends partly on the event’s purpose. If the event is a fundraiser that designed to raise money primarily through ticket sales, then the methods we used to value online donations will work well. However, what about events that use ticket sales and an auction to generate revenue? We already know how to calculate the value of the ticket sales, but how do we determine the portion of auction revenue driven by your website? Cross-reference your list of auction participants and their winning bid amounts with the list of people who signed-up online. All of the auction revenue from people who registered for the event online can be attributed to your website. So, the average value of a visit to your event registration page is the total revenue generated by that page divided by the number of people who visited it.
Avg. Value of Visits to Events Page =
Ticket Revenue + Auction Revenue/Total # of Events Page Visits
Finally, we are faced with the challenge of figuring out what a mailing list sign-up via your website is worth. The solution is similar to how we determined the portion of event auction revenue driven by your website. You’ll need to cross-reference your donor list with the list of people who signed-up for your mailing list via the website. When a donor appears on both lists, then some or all of that person’s donation should be credited to your website. The portion of the donation that is credited to the website could depend on how much time has passed since the mailing list sign-up and/or how much contact your development staff has had with the donor in the interim. The average value of a mailing list sign-up on your website is the total revenue generated (i.e., donations made) by people who signed-up during a month (week, quarter, etc.) divided by the number of sign-ups. Similarly, the value of a visit to your mailing list sign-up page is the total revenue generated by that page divided by the number of people who visited it.
Average Value of Visits to Sign Up Page =
Total (or % of) Donations from people signed up via your website/Total # of Sign Up Page Visits
If you’d like more information on how to use Google Analytics please visit
this website
or follow their blog
here
.
Posted by Sam Franklin, AdWords Team
Labels
AdWords Basics
98
AdWords in the Curriculum
9
Google Analytics
9
Google Apps
25
Google Apps Highlights
10
Google Earth
18
Google Earth Outreach
28
Google for Nonprofits Blog
529
Google Fusion Tables
2
Google Maps
10
Google Products
63
Google Sketchup
2
Google+
16
Grantees
98
Grants Program
97
Optimization
59
Program Alerts
15
Resources for Non-Profits
179
Tracking Performance
35
YouTube
26
Archive
2016
Sep
Aug
Jul
Jun
Apr
Mar
Jan
2015
Nov
Sep
Aug
Jul
Jun
May
Apr
Feb
2014
Nov
Oct
Aug
Jul
Jun
Apr
Feb
2013
Dec
Nov
Oct
Sep
Aug
Jul
Jun
May
Apr
Mar
Feb
Jan
2012
Dec
Nov
Oct
Sep
Aug
Jul
Jun
May
Apr
Mar
Feb
Jan
2011
Dec
Nov
Oct
Sep
Aug
Jul
Jun
May
Apr
Mar
Feb
Jan
2010
Dec
Nov
Oct
Sep
Aug
Jul
Jun
May
Apr
Mar
Feb
Jan
2009
Dec
Nov
Oct
Sep
Aug
Jul
Jun
May
Apr
Mar
Feb
Jan
2008
Dec
Nov
Oct
Sep
Aug
Jul
Jun
May
Apr
Mar
Feb
Feed
Google
on
Follow @googlenonprofit
Follow







 Follow