For Nonprofits Blog
You're changing the world. We want to help.
Creating a measurement strategy for your nonprofit
Monday, June 24, 2013
As nonprofits, measuring the success of your organization can often be tricky. If your mission is “Improving lives”, what metrics can you use to show that? We’d like to help. We’ve created a framework that you can use to evaluate your nonprofit more effectively. Follow along with me below and by the end we’ll have developed metrics, targets and much more that will allow you to show the success and growth of your nonprofit.
To get started, we’ll use a fictional nonprofit called Nonprofit X or NPX, for short.
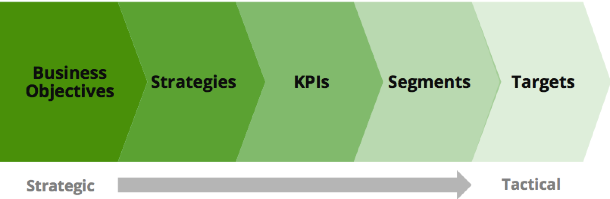
1. Everything starts with the organizational mission
. Once we know that, we can investigate the strategies and tactics needed to execute that mission or business objective. All along the way, we’ll define pieces of data that help up measure the performance. For our fake nonprofit, NPX, our mission will be to “Improve the lives of those that are in need of stable, safe housing.” Knowing our mission is important because that’s what we’ll measure and how we’ll define success for our strategies and other tactics. In the case of NPX, our measure of success is improved lives. Although that metric doesn’t exist in any tool, we can use it to define strategies that accomplish it.
2. Identify strategies to accomplish your mission.
We can identify strategies by interviewing people at the top: board members, executives, etc. For NPX, we have three primary strategies: fund homebuilding projects by generating donations, coordinate volunteers to build houses and raise awareness of our cause. Once your team works together to outline strategies, your next step is to outline tactics.
3. Outline tactics to execute your strategies.
Nonprofits can have one or more tactics to achieve each strategy. Strategies don’t often change over time, but the methods or tactics we use to implement those strategies do. To keep things simple, we’ll keep all of of our NPX tactics web-based. NPX’s tactics include collecting donations via a website, recruiting volunteers via a website and educating the public about the lack of housing via an informational website. With our tactics ready, we’ve now reached the good part.
4. Measure tactics with key performance indicators (KPIs).
Each KPI should measure the performance for our tactics. Creating KPIs can be a bit tricky, since you have to understand how to measure your top line strategy (mission, etc), but also what you’re capable of tracking with your tools. You don’t need several KPIs for each tactic, maybe 3 to 5 for each. For our NPX tactic of collecting online donations, we’ll want to look at metrics like revenue and average donation size. With recruiting volunteers, our KPIs will be the number of volunteers and number of searches for volunteer activities. We’ll measure our success in educating the public with how many people submit a letter to congress on our behalf and watch our informational video.
5. Identify segments to understand changes in your KPIs.
Segmentation, which is the foundation of all analysis, helps us understand why our KPIs move up, down or stay the same.
For our donation strategy, we’ll want to split revenue by marketing activity that generated the revenue so we can calculate ROI. We’ll also want to segment donation based on donation type and identify repeat donors.
Segmenting the volunteer KPIs is similar. We’ll want to see how different marketing campaigns perform, differentiate repeat volunteers from first-time volunteers and segment based on geographic location (as NPX volunteer opportunities are geographically based).
Next is cause awareness. We’ll start by segmenting by traffic source, visitor type and content type. We want to know what sources brought in our users, so we can spend money and time around those in the future and be able to see how people are engaging on our site.
Now that we have segments, it’s time to add some context to the data in the form of targets.
6. Add context to your segments and KPIs with context.
Targets are how almost every business evaluates performance. Organizations, at the beginning of the year, often lay out where they want to be every month or quarter. Then as the year proceeds you can compare where you’re at with where you need to be. You can also account for upcoming activities when determining if you will, or will not, make your targets.
Now that we’ve created our measurement strategy, we’ll need a way to get our measurements. So next up, we’ll show you have to translate this plan into a Google Analytics implementation. If you’d like to kickstart learning about Google Analytics, check out our
guide
and
video tutorial
designed specifically for nonprofits.
*The original framework was created by fellow Googler
Avinash Kaushik.
Posted by Justin Cutroni, Google Analytics team
Results of the first ever survey on nonprofits using online video
Wednesday, June 19, 2013
Everyday we see inspiring, educational, and creative nonprofit videos on YouTube. Nonprofits of all sizes are using video to reach new constituents and turn video views into action. We launched the
YouTube Nonprofit Program
in 2007 to help organizations take their work to the next level, and since then, more than 20,000 nonprofits have joined the program.
But we want to see even more great nonprofit organizations take advantage of the powerful storytelling options that video allows them. That’s why
we joined with
See3 Communications
and
Edelman
to find out just how nonprofits are using online video and how we can better help them. Together we launched our first survey of nonprofit online video use. We tallied results from over 450 respondents, including senior management
, marketing
, and video production professionals from organizations of varying sizes and missions. Their video skills were equally as mixed
- some are already using video within campaigns
, while others are just
buying their first camera.
You can download the full survey results
here
.
The guide includes survey data and insights from nonprofits who have had a lot of success and online video experts.
In a nutshell, here’s what we learned:
According to the survey,
nearly all nonprofits recognize the significance of the “video revolution”, but few feel prepared to use this powerful communications tool to its full potential.
There is a clear understanding that video is a necessary tool to reach constituents and key audiences, but how to measure success and return on investment is less clear.
80%
of respondents said that video is important to their organization today
91%
of respondents want to be making more video
62%
of respondents designate very little or no staff time for video production and distribution
76%
of respondents either don’t know how to measure video success or only track it anecdotally
If you’re a nonprofit and you’re struggling to use online video online video or if you just want to learn more about how to launch video campaigns and track your progress, here are some resources to check out:
YouTube.com/nonprofits
-
Interested in joining us on YouTube? Visit this site to learn about the program, find resources and apply to the program
.
Playbook for Good
-
This guide walks through best practices specifically for nonprofits using Youtube. From developing content to adding the Google Wallet “Donate” button, you’ll get an in depth view of how you can activate your cause on YouTube.
Nonprofits on YouTube video series.
Starting today, you can access our video series sharing short lessons and tutorials for creating your online videos. We’ll be posting new trainings weekly through July. Check out the first three below.
Whether you’re creating your first video or adding content to an existing campaign, we can’t wait to see you inspire the YouTube community.
Posted by Jessica Mason, YouTube for Nonprofits team
Join us in Sacramento and grow your nonprofit online
Tuesday, June 18, 2013
Are you interested in growing your nonprofit online and learning how Google for Nonprofits can help you do just that? If so, we’re hosting a training event at no cost in Sacramento
today
, June 18th from 1:00 - 4:00 pm PT
and we’d love for you to join us. We’ll host a few different sessions (listed below) to provide guidance on tools and resources to help your nonprofit improve operations, increase online exposure and connect you with supporters.
Google for Nonprofits and growing your business online.
We’ll show you how to apply to our Google for Nonprofits program and how, once accepted, you can use the tools to run your organization more efficiently -- leaving you with more time to better your community and the world.
YouTube for Nonprofits
. Our team will walk through how you can connect with supporters, volunteers and donors through videos on YouTube. We’ll also explore how you can use YouTube tools to livestream events, track campaign goals and allow donors to give straight from YouTube with the convenient “Donate” button.
Create a business listing on Google.
Help current and potential supporters find your organization on Google.com search results, Google Maps and Google+ by creating a business listing. We’ll take you step-by-step through the process so you can reach more people interested in your cause.
If you’d like to join us, you can find all the details
here
. Walk-ins are welcome, so invite your friends and meet us in Sacramento!
Posted by Leslie Dinneen, Google for Nonprofits team
Inspiring awareness and engagement with Google Earth Outreach
Wednesday, June 12, 2013
Whether it’s YouTube videos, Google+ events or Google’s mapping tools, we’re constantly inspired by the ways nonprofits tell their stories and spark community action. We’d like to share the work of three environmentally focused nonprofits who have used Google Earth and Maps to raise awareness and encourage involvement.
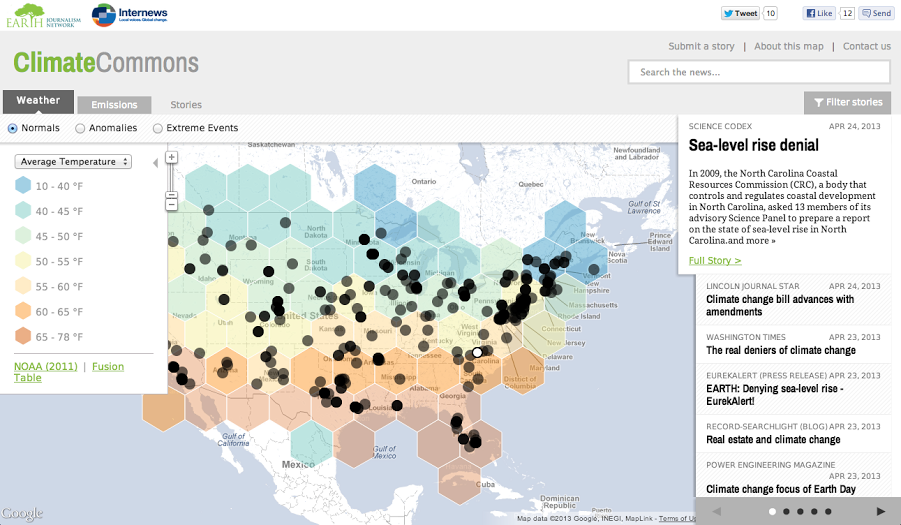
Climate Commons Map
Internews’
Earth Journalism Network
recently launched
Climate Commons
, funded with a
Google Earth Outreach Developer Grant
. Climate Commons is an interactive map that aims to track the impacts of and responses to climate change on a local, regional and national level across the United States. The map overlays relevant data showing climate change indicators (temperature, precipitation, emissions, etc.) with the latest, geo-tagged stories about climate change from around the US. Check out the
Climate Commons map
to explore both the climate change data and the media coverage around it.
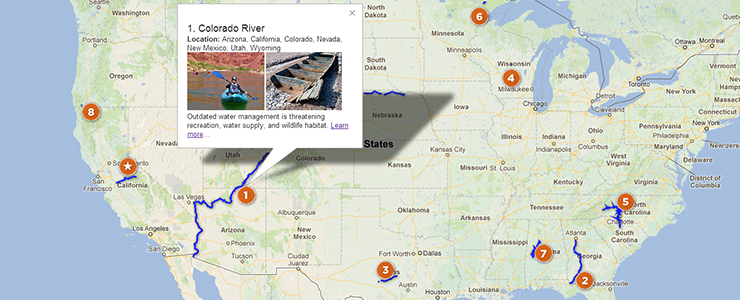
American Rivers Map
Every year,
American Rivers
names 10 rivers as America’s
Most Endangered Rivers
because they are facing specific threats and because their uncertain fates will be decided in the coming year. Using
Google Maps Engine
, American Rivers built an interactive map that allows users to explore the rivers and learn more about how they can get involved. Try out the map for yourself
here
.
EOL Monarch Butterfly Tour
Each year, Danaus plexippus, also know as the eastern monarch butterflies, begin a migration across North America. To illustrate the butterflies’ epic journey, the
Encyclopedia of Life Learning + Education group
and
Atlantic Public Media
produced a
Google Earth Tour of their migration
. The tour is coupled with
companion podcasts
, adding additional insights and commentary to this geographic storytelling. Begin exploring the migration with
this kml file
, or with the video below.
If you’d like to use Google Earth and Maps to help tell your story, you can get started by visiting the
Google Earth Outreach site
or watching
our video tutorials designed specifically for nonprofits
. You can also apply for a Google Maps Engine grant
here
.
Posted by Raleigh Seamster, Google Earth Outreach team
Labels
AdWords Basics
98
AdWords in the Curriculum
9
Google Analytics
9
Google Apps
25
Google Apps Highlights
10
Google Earth
18
Google Earth Outreach
28
Google for Nonprofits Blog
529
Google Fusion Tables
2
Google Maps
10
Google Products
63
Google Sketchup
2
Google+
16
Grantees
98
Grants Program
97
Optimization
59
Program Alerts
15
Resources for Non-Profits
179
Tracking Performance
35
YouTube
26
Archive
2016
Sep
Aug
Jul
Jun
Apr
Mar
Jan
2015
Nov
Sep
Aug
Jul
Jun
May
Apr
Feb
2014
Nov
Oct
Aug
Jul
Jun
Apr
Feb
2013
Dec
Nov
Oct
Sep
Aug
Jul
Jun
May
Apr
Mar
Feb
Jan
2012
Dec
Nov
Oct
Sep
Aug
Jul
Jun
May
Apr
Mar
Feb
Jan
2011
Dec
Nov
Oct
Sep
Aug
Jul
Jun
May
Apr
Mar
Feb
Jan
2010
Dec
Nov
Oct
Sep
Aug
Jul
Jun
May
Apr
Mar
Feb
Jan
2009
Dec
Nov
Oct
Sep
Aug
Jul
Jun
May
Apr
Mar
Feb
Jan
2008
Dec
Nov
Oct
Sep
Aug
Jul
Jun
May
Apr
Mar
Feb
Feed
Google
on
Follow @googlenonprofit
Follow


 Follow